Detailed Scientific Methods, HABs
INDICATOR DEVELOPMENT
1. Measurement Type
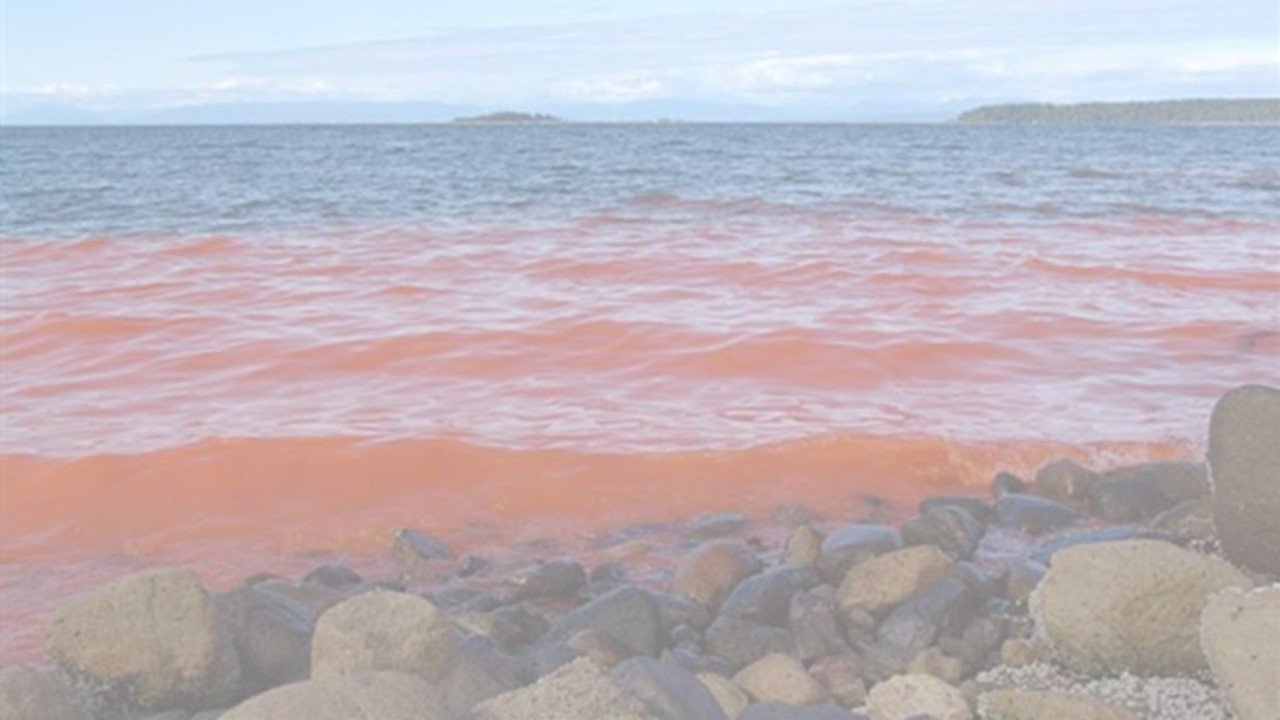
HABs are monitored using two general approaches by scientists and resource managers: (1) monitoring impacts of HABs and (2) monitoring the presence of HAB species or toxins in the environment. The impacts of HABs are multiple and range from the contamination of socially and economically important fisheries to the sickening of marine wildlife. The HABs indicator relies on metrics of HAB impacts, focusing on HAB toxin bioaccumulation into shellfish, which has been occurring routinely for nearly 30 years along the US West Coast. Marine mammal stranding counts, which are used as supporting information for this indicator but do not inform the status assignment and are not included in trends analysis due to issues with data certainty. Marine mammal stranding data can provide insights into the trophic transfer of one HAB toxin in particular, domoic acid, into the upper trophic level. The indicator focused on data linked to impacts compared to data describing the presence of HAB species or toxins in the environment because the mere presence of HAB species or toxins in water samples does not necessarily mean that a harmful impact has occurred.
2. Datasets
The HABs Indicator currently relies on records of biotoxin shellfish health advisories and closures due to HAB toxin bioaccumulation in shellfish is monitored by a consortium of management agencies in each state along the U.S. West Coast. In California, shellfish monitoring and management is conducted collaboratively by the California Department of Public Health, the California Department of Fish and Wildlife and the Office of Health Hazard Assessment. In Oregon, shellfish monitoring is conducted by the Oregon Department of Fish and Wildlife and Oregon Department of Agriculture. On the outer coast of Washington, shellfish are managed via joint inter-governmental agreement between the State of Washington and the Quinault Indian Nation, Makah Tribe, Hoh Indian Tribe and The Shoalwater Bay Indian Tribe. State monitoring and management is conducted collaboratively between Washington Department of Public Health and Washington Department of Fish and Wildlife.
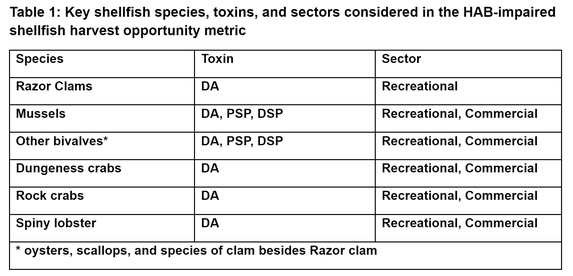
The duration of advisories and/or closures for each of the key shellfish fisheries described in Table 1 were calculated for each of the coastal counties or zones for both recreational and commercial sectors. Only the open coast and open coast embayments were considered. For commercial fisheries, there were instances where an advisory and subsequent full closure was issued for the same stretch of coastline within a county or zone. In those instances, the dates of both the advisory and closure were noted. However, only the closure dates were included in the final calculation of HAB impaired shellfish harvest opportunity in those instances to avoid double counting days for a given event. For crustacean species, advisories sometimes indicated a recommendation to remove viscera before consumption. The duration of these advisories were included in the HAB impaired shellfish harvest opportunity calculation. For several fisheries, monitoring is conducted all year regardless of quarantines or fishing season. Any advisories or closure issued during annual quarantine or closed season periods were not counted in the HAB impaired shellfish harvest opportunity calculation.
Domoic acid stranding events were estimated using the Level A NOAA stranding database, which contains species level demographic information on stranded marine mammals. These data provide very limited health and diagnostic data related to the cause of stranding, thus domoic acid related stranding were inferred by examining an indicator demographic. Level A NOAA data was filtered by animals that stranded alive or freshly dead within each of the coastal counties along the U.S. West coast. A probable event year was identified by calculating the percentage of adult female California Sea Lions that stranded compared to the total number of California Sea Lions of any demographic that stranded for a given year.
3. Unit of Assessment
HAB Impaired shellfish harvest opportunity is assessed by either county or harvesting zone, depending on which spatial unit was most applicable to the management framework of the given state. In California and Oregon, days were tallied by county. In Washington, days were tallied by harvesting zone, which often included one or more counties or Tribal Lands. In some cases, advisories/closures were issued for specific stretches of a coastal county or zone. In these instances, the number of days under an advisory/closure were counted as HAB impaired shellfish harvest opportunity days within that county, even if there were stretches of coast that were still open within that county. In instances where multiple stretches of a given county or zone were closed sequentially, the start of the closure for the county was counted as the first date for which an individual stretch was closed, and the opening date was counted as when there were no active advisories/closures in that county for a given fishery.
4. Status
The status for the entire U.S. West Coast is synthesized by tallied for each coastal county or harvesting zone along the West Coast and then calculated as a percentage of total potential harvest days for all monitored shellfish species. This percentage is then assessed as Far Below, Below, Meeting, Above, or Far Above Expectation. The Expectation categories are defined from the deviation from the historical baseline.
5. Trend
Trends are assessed by looking for a linear trend for the full historical period. Based on the significance and magnitude of the trends for each county or zone, the overall U.S. West Coast is categorized as Getting Better, Slightly Better, No Trend, Slightly Worse, or Getting Worse.
INDICATOR REVIEW
Please pardon our dust. This section is in progress.
INDICATOR CONFIDENCE
Please pardon our dust. This section is in progress.
CALCULATION METHODOLOGY
The percent of HAB-impaired shellfish harvest opportunity was calculated using the following equation:
% Total HAB impaired harvest opportunity =
(# of days of closures for all coastal counties or zones/(# of counties or zones *365*2 sectors))*100
We then calculated the proportion of HAB-impaired opportunity by sector using the following equation:
Sector proportion =
(# days for given sector/total number of closed days)* % Total HAB impaired harvest opportunity
Placeholder: Detailed Methodology and equations (webpage or pdf)
LOOKING AHEAD
Please pardon our dust. This section is in progress.
Photo Credits: Woods Hole Oceanographic Institution.