
Detailed Scientific Methods, Kelp

INDICATOR DEVELOPMENT
1. Measurement Type
There are several approaches that are presently used to monitor kelp, falling into two primary classes: (1) in-situ surveys conducted by divers and (2) overhead surveys that measure the extent of emergent kelp canopy on the ocean surface. The Kelp Indicator relies on overhead surveys to report on the status and trends of kelp, as these surveys, collectively, offer both greater spatial coverage and temporal fullness and duration than that of underwater surveys. For example, measurements of kelp canopy at the surface are routinely collected along the U.S. West Coast from both aerial overflights and multiple satellite platforms. However, because overhead surveys only measure what is at the surface, this Kelp Indicator does not include understory species that don’t reach the sea surface. This is an assessment of the two primary canopy-forming kelp species along the U.S. West Coast, bull kelp and giant kelp (Nereocystis luetkeana and Macrocystis pyrifera).
2. Datasets
The indicator relies on a combination of overhead datasets. From the U.S.-Mexico border northward through Oregon, we are relying on the SBC LTER: Time series of quarterly NetCDF files of kelp biomass in the canopy from Landsat 5, 7, and 8 since 1984 (ongoing). There is literature support that Landsat provides a good representation of kelp canopy dynamics from south of the U.S.-Mexico border through northern California and Oregon. In Washington, we rely on aerial overflights. Generally, there is concern that the ephemeral nature of bull kelp and the increasing biases of tides, clouds, and complex coastal geomorphology moving northward along the coast necessitated comparisons among overhead-type datasets. Comparisons among datasets are underway.
While the Landsat-based kelp canopy dataset is a quarterly time-series, the group recommended to create an annual time-series because there are two canopy-forming kelp species along the U.S. West Coast that vary in timing and magnitude of seasonality. The recommended metric from the quarterly dataset was the maximum annual coverage. The result is an annual time-series since 1984. The aerial overflight data used for Washington coastal segments is also an annual data product. Its updates lag approximately 2 years.
3. Unit of Assessment
Kelp is being assessed for the three U.S. West Coast states, California, Oregon, and Washington. This includes California’s mainland and northern and southern Channel Islands, Oregon’s mainland coastline, and Washington’s outer coast and western Straits of Juan de Fuca. Currently the inner straits and Puget Sound region of Washington, which contains canopy-forming kelp, are assessed by the Kelp Forest Monitoring Alliance of Washington State.
Kelp canopy is assessed along semi-regularly spaced coastal segments of approximately 10 km in length that extend the entire coast. Coastal segments were adopted from pre-existing coastal polygons developed for kelp application (Washington DNR and Oregon DFW) or made de novo for this assessment (California).
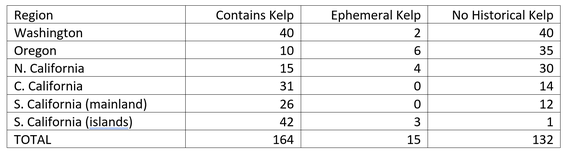
Coastal segments are categorized by whether or not they have historically contained kelp. The categories are “No Historical Kelp,” “Ephemeral Kelp,” and “Contains Kelp.” Segments with < 0.02% of its area with kelp-containing pixels were categorized as having “No Historical Kelp”; segments with either < 0.15% of its area with kelp-containing pixels or had no kelp for more than half of the years during the historical baseline were categorized as having “Ephemeral Kelp”; otherwise, the segment was categorized as “Contains Kelp.”
Applying this routine to the U.S. West Coast produces a total of 311 coastal segments. Table 1 shows the number of segments in each category by geographic region. For the Indicator, we refer to segments with kelp as “kelp-containing segments” as opposed to “kelp beds.” This was recommended by the group.
Table 1. Number of coastal segments that contain kelp, have ephemeral kelp, or have no historical kelp by region.
4. Status
Defining the Baseline. The current annual status of kelp is assessed relative to a historical baseline. The baseline is established from data available prior to the marine heatwave of 2014-2015. The baseline is calculated as the median kelp canopy coverage from the years 1984-2013 for each coastal segment. The median was chosen given the nature of the data; for the majority of kelp-containing segments the time-series of annual maximums have non-normal distributions.
Status Metric. Status is maximum annual coverage of the most recent year relative to the median of the historical baseline. Figure 1 demonstrates the data for a single coastal segment.
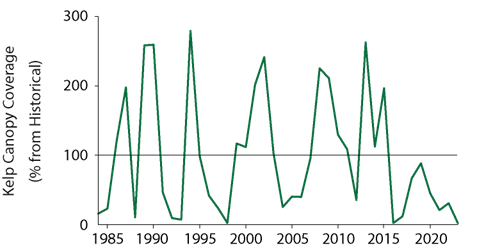
Figure 1. Time-series of kelp canopy coverage relative to the historical baseline (%) for a single coastal segment (CA_3; Point Loma Kelp Forest). Historical baseline is the median canopy coverage from 1984-2013.
In this example, the 2023 status for this segment is < 1% of the historical baseline. This exercise has been repeated for all kelp-containing segments.
5. Trends
Long-term linear trends. Long-term trends were assessed using the full extent of the available dataset (1984-2023). Within each kelp segment, we applied a linear fit to the annual time-series of kelp coverage relative to the historical median. Linear trends were assessed as significant if the slope was significantly different than zero (alpha = 0.05). For all analyses we use the maximum annual coverage relative to the historical median (as shown in Figure 1). Changes for linear tests are expressed as a percent loss per year.
Recent trends. Please pardon our dust.
CALCULATION METHODOLOGY
Status
Coast-wide Integration of Status. To evaluate status across the U.S. West Coast, we look at the empirical cumulative distribution function (eCDF) of all kelp-containing segments (Figure 2). For 2023, this reveals that 72% (118 out of 164) of kelp segments had kelp canopy coverage below the historical expectation (purple circle).
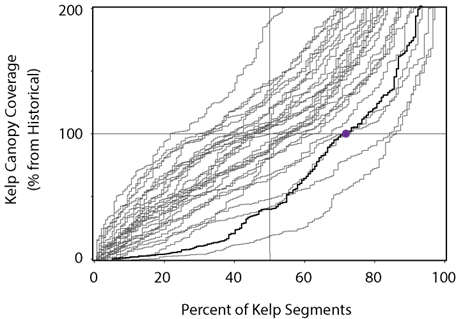
Figure 2. Empirical cumulative distribution function of kelp canopy coverage (percent) relative to the historical baseline for all kelp-containing segments along the U.S. West Coast. Year 2023 (black line) contrasted with years from the historical baseline (grey; 1983-2013).
To assess the coast-wide status of kelp relative to the historical baseline, the 2023 eCDF is contrasted with the eCDFs from the historical baseline years (1984-2013). In particular, we extract the percent of kelp segments above their historical baseline for each year (akin to [100 – purple circle] in Figure 2), which follows a normal distribution. The categories for the gauge – Far Below, Below, Meeting, Above, Far Above – are defined relative to the first and second standard deviation of these metrics.
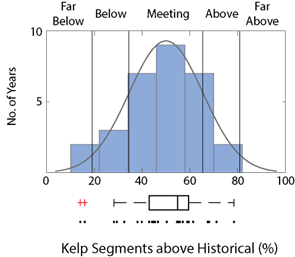
Figure 3. Translation of coast-wide coverage metrics to the five categories that define the gauge. The histogram with normal distribution, box plot, and yearly values of the percent of kelp-containing segments above their historical baseline (n = 30 years; 1984-2013). Categories are defined from the first and second standard deviations relative to the mean (vertical grid lines with categories above the plot).
Uncertainty in Status Assessment. Please pardon our dust.
Trends
Coast-wide Integration of Trends. The average coast-wide linear regression slope of all kelp-containing segments is estimated with a 95% confidence interval using the following equations.
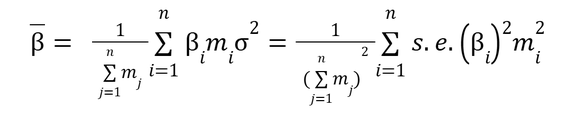
where n is the number of kelp-containing segments, mi is each segment’s historical median, and i and s.e.i are the calculated slope values and their associated standard errors for each kelp-containing segment. is then the point estimate for our coast-wide trend, and a 95% confidence interval around is generated.
When the confidence interval contains zero, we conclude there is not enough evidence to distinguish from zero and concluding there is No Trend in coast-wide kelp. Otherwise, we conclude with 95% confidence that is either less than or greater than zero and that there is either a Worse or Better Trend, respectively. When the coast-wide trend exceeds a rate beyond ± 2%, it is assessed as Far Worse or Far Better.
INDICATOR REVIEW
This indicator was developed in collaboration with a group of kelp experts. The group went through a process to assess types of data available for a kelp indicator and recommend which datasets were best suited for coast-wide application. The group then conceptualized the Status and Trends indicator, reviewed the methodology, and produced the graphics and content for the Kelp Indicator 2-page Summary and supporting website. A manuscript is in progress.
Kelp Expert Group Participants:
Benjamin Grime, The Nature Conservancy
Christina Frieder, Southern California Coastal Water Research Project
Danielle Claar, Washington State Department of Natural Resources
Ed Parnell, Scripps Institution of Oceanography
Eric Nielsen, Portland State University
Helen Berry, Washington State Department of Natural Resources
Henry Houskeeper, Department of Applied Ocean Physics and Engineering, Woods Hole Oceanographic Institution
Jan Freiwald, Reef Check Foundation
Kate Cavanaugh, UC Los Angeles
Kyle Cavanaugh, UC Los Angeles
Gray McKenna, Washington State Department of Natural Resources
Pike Spector, Ocean Protection Council
Sara Hamilton, Oregon Kelp Alliance
Scott Marion, Oregon Department of Fish and Wildlife Marine Resources Program
Tom Calvanese, Oregon Kelp Alliance
Tom W Bell, Department of Applied Ocean Physics and Engineering, Woods Hole Oceanographic Institution
Tristin McHugh, The Nature Conservancy
LOOKING AHEAD
Please pardon our dust. This section is in progress.
Photo Credit: kelp indicator export group members, including Oregon Kelp Alliance (ORKA), Tristin Anoush McHugh (The Nature Conservancy), and Pike Spector (California Ocean Protection Council).