
Kelp — Explore the Indicator
The West Coast Ocean Health Dashboard Kelp Indicator relies on remotely sensed data of kelp canopy at the sea surface. It assesses the two kelp species that are canopy-forming along the U.S. West Coast, Nereocystis leutkeana and Macrocystis pyrifera. Canopy-forming kelp exists along the mainland coastlines of all three states, as well as the islands off southern California. Indicator methods available here.
What is the coast-wide status of kelp this year?
Status
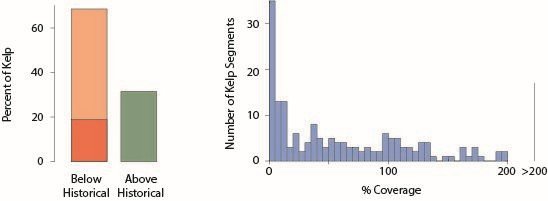
More than 72% of kelp canopies along the coast were below historical expectation, with 20% of kelp canopies having essentially no canopy.
This figure shows...
the percent of kelp segments that are above or below their historical baseline. The percent of kelp segments with essentially no kelp are indicated in dark pink shade. Kelp canopy is assessed as the amount of coverage relative to the historical baseline, which is median coverage from all 1984-2023. No kelp is defined as less than 5% of canopy relative to historical. (Right) This figure shows the histogram of kelp canopy coverage (percent relative to the historical baseline) for all kelp canopy segments. There are 17 segments (out of 184 total) that fall above 200% (indicated).
How does kelp status vary along the coast?
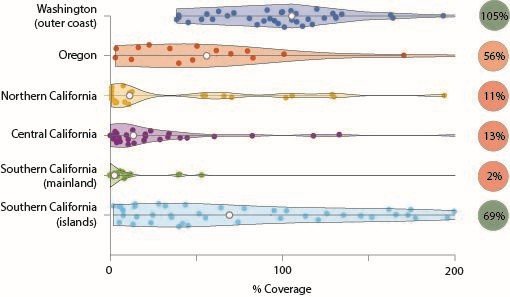
Along Washington’s northern outer coast and Strait of Juan de Fuca, kelp canopies are doing well and on par with historical coverage. This is in contrast to declines that have been documented in Central and Puget Sound by the Kelp Forest Monitoring Alliance of Washington State (not shown in figure). Along Oregon’s coast, kelp canopy is half what it was during the baseline period. Some of Oregon’s largest kelp forests near Port Orford are doing the worst. Along all of California mainland, kelp had a poor year as well, although underlying causes likely differ for the different regions. The islands off southern California had the most varied response, but on the whole were below historical expectation.
This figure shows...
the percent coverage of kelp canopy by coastal bioregion. Individual coastal segments are shown as circles with region-wide coverage indicated on the right.
How does this year compare to others?
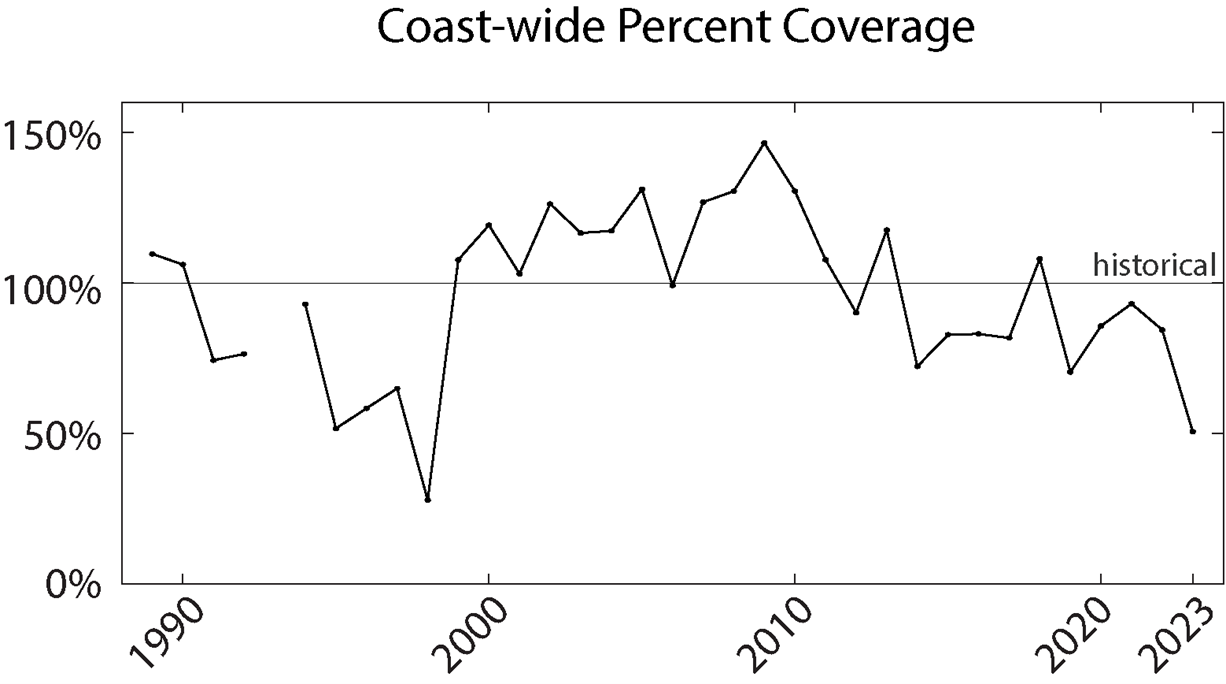
Coast-wide, this was the second to worst year on record, and the worst year in the last two decades. The only year where coast-wide kelp canopy coverage was lower was during the 1998 El Nino event. Further, 9 of the past ten years have been below historical expectation.
This figure shows...
the time-series of coast-wide percent coverage of kelp canopy relative to historical. The coast-wide value is calculated as the median percent coverage of all kelp-containing coastal segments.

How is kelp changing?
Trends
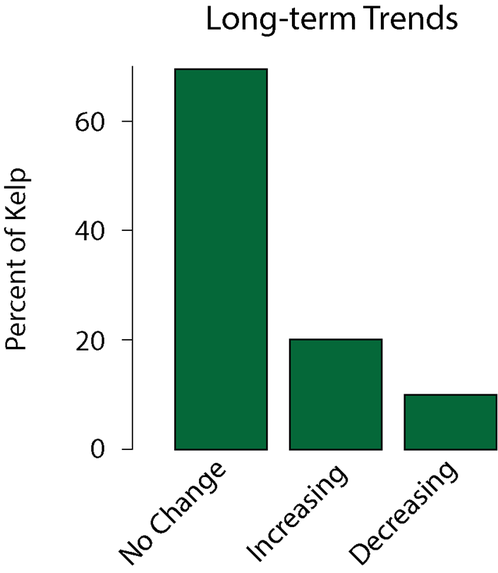
The vast majority of kelp along the coastline is not undergoing long-term linear changes. Kelp canopy coverage is highly dynamic on seasonal, interannual, and decadal time scales. Long-term linear increases are detectable in 20% of the coastal segments, and long-term linear declines are detectable in 10%.
This figure shows...
the percent of kelp segments that have significant long-term linear trends from the full extent of data available.
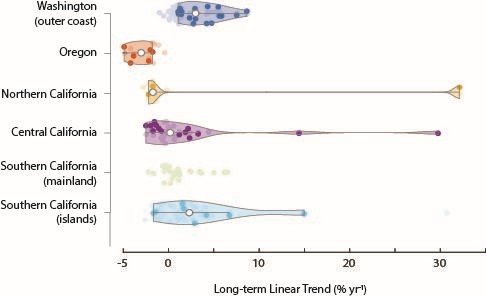
How do trends in kelp compare geographically?
Kelp canopy trends show geographic pattern among major bioregions. Most of the kelp canopies undergoing long-term increases are occurring along the outer-coast of Washington. This is countered in Oregon and northern California by kelp canopy decreases. The long-term change is more varied in central California and southern California. Long-term linear decreases range from -0.5% to up to -5% per year. While long-term linear increases greater than 10% are observed for just a few beds (4 of 163 total), indicating possible emergence of larger beds than historically observed.
This figure shows...
the change in kelp canopies by coastal bioregion. Individual coastal segments are shown as circles. Segments with non-significant long-term linear trends are in lighter colors; segments with significant long-term linear trends are shaded in darker colors along with violin plots for those segments.
Trend Story: Point Loma Kelp Forest
An example from an individual kelp bed with high year-to-year variability
The Point Loma Kelp Forest is one of the West Coast’s largest giant kelp forests. The forest spans along 10 km of coast between San Diego Bay and Mission Bay in San Diego, California. The forest has a rich history of observation. Kelp canopy coverage detected by satellite has been highly variable since the early 1980’s to the present. In 2023, kelp canopy coverage was at less than 1% of the historical median. Very little canopy was detected. The recent low is not part of a long-term trend (loss since 1984). However, since 2017, kelp canopy coverage has (on average) been at 40% of the historical baseline.
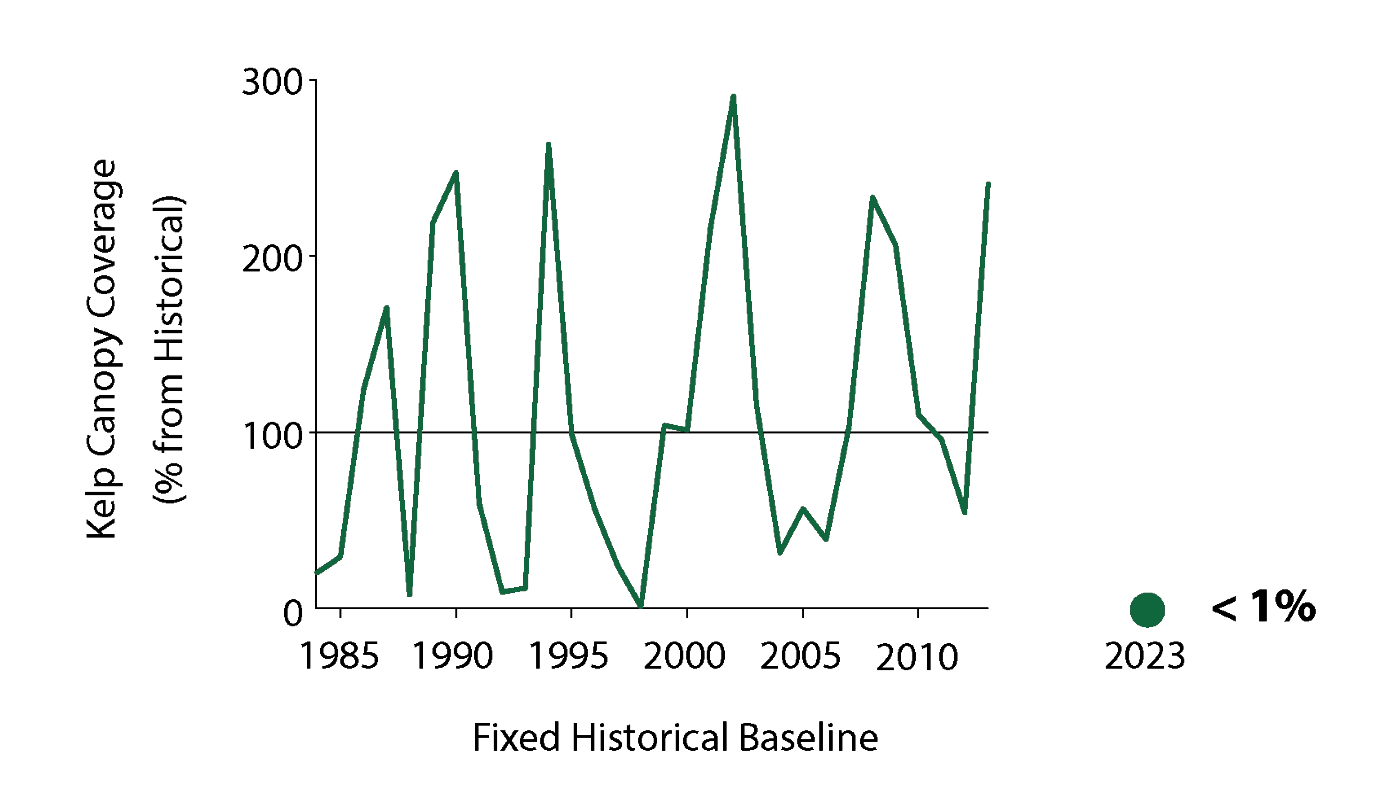
This figure shows...
kelp canopy coverage for the Point Loma Kelp Forest for the historical baseline period. Data is plotted as a percent of the historical median (1984-2013). The percent coverage for the current year is shown. Values above 100% are more kelp canopy relative to the historical baseline; values less than 100% are less kelp canopy relative to the historical baseline.
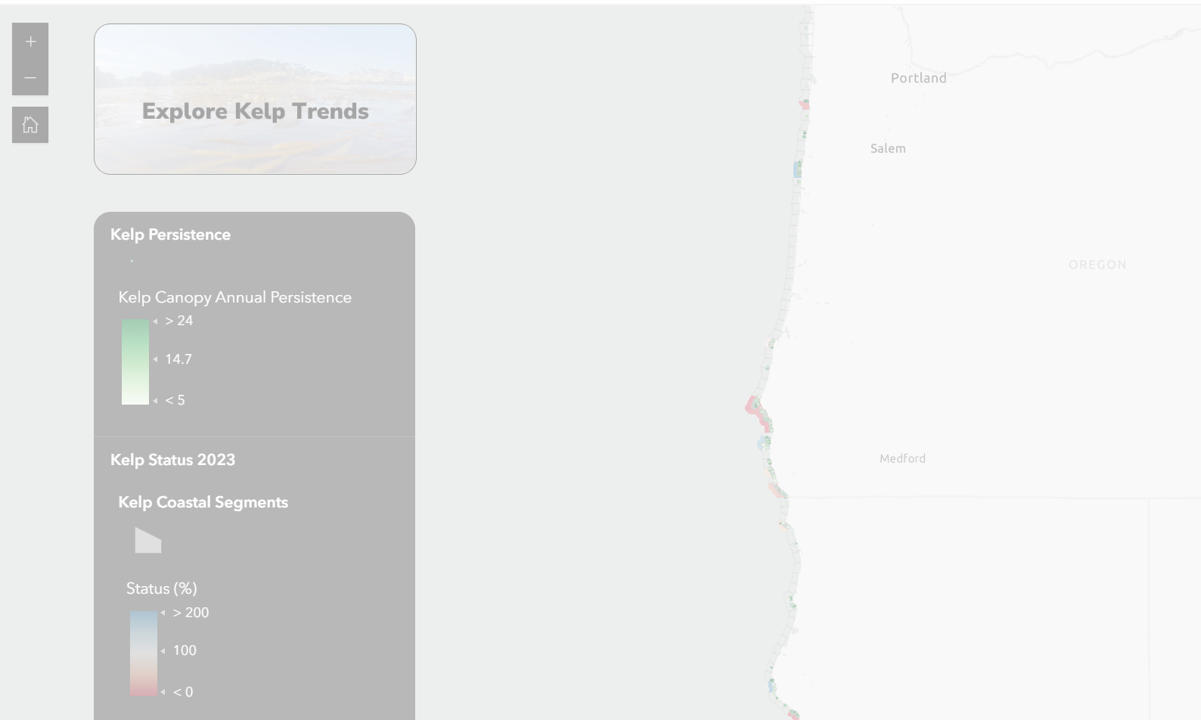
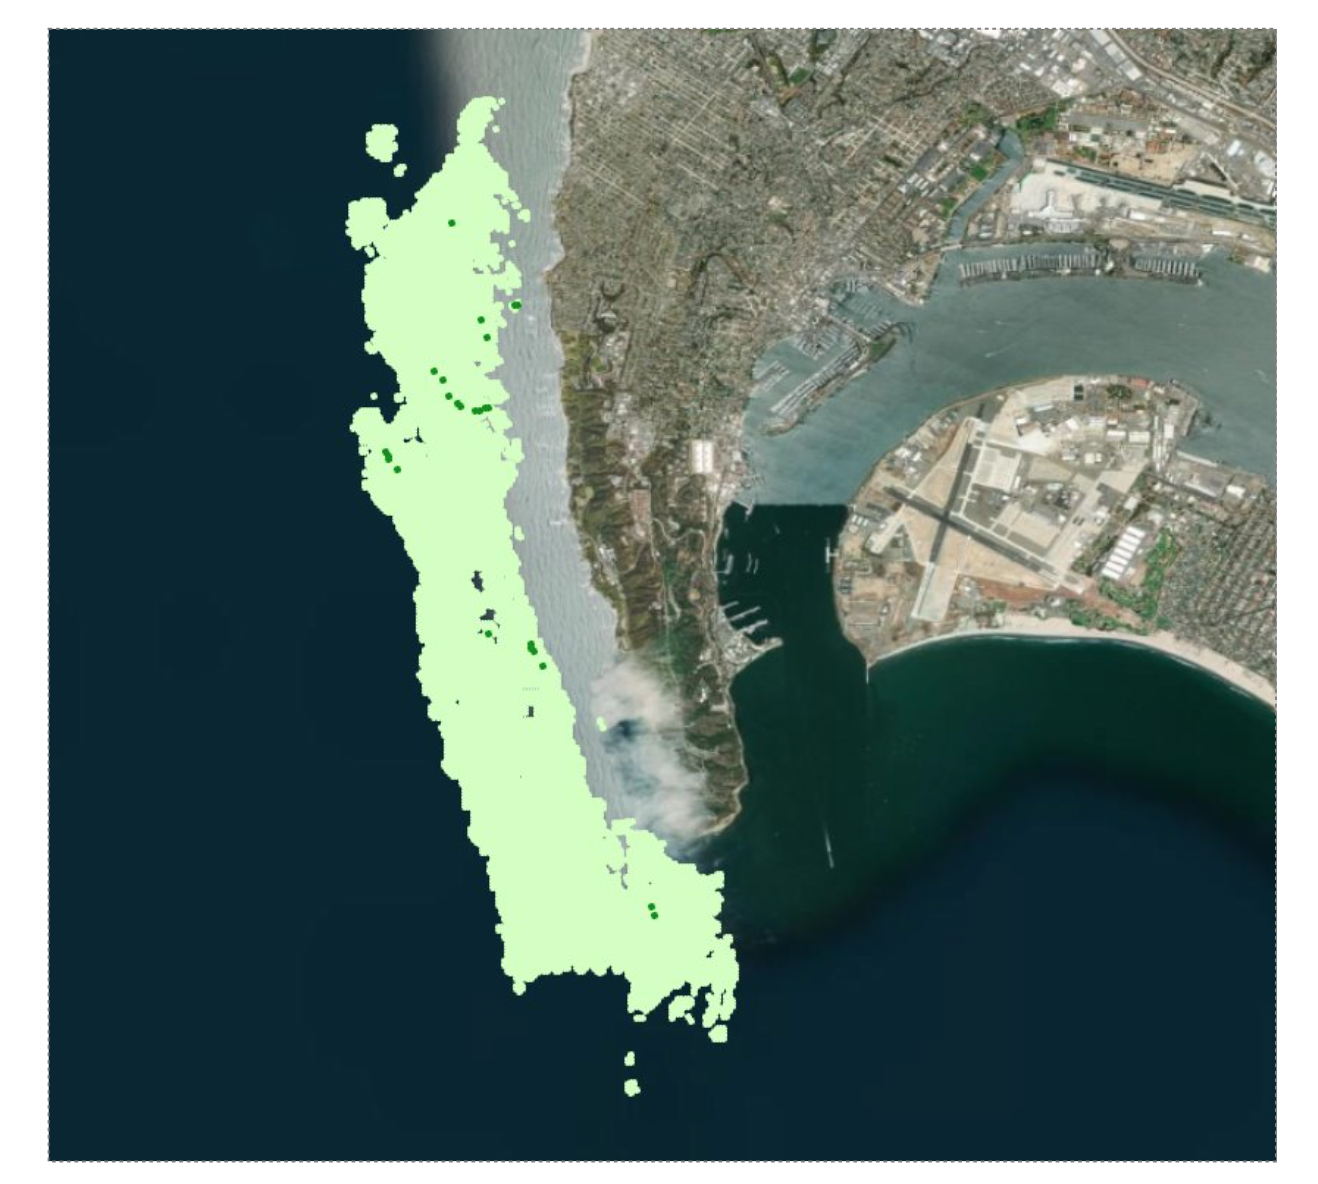
This map shows...
the full historical extent of kelp canopy detection (light green) and where kelp canopy was detected (dark green) for the most recent year.
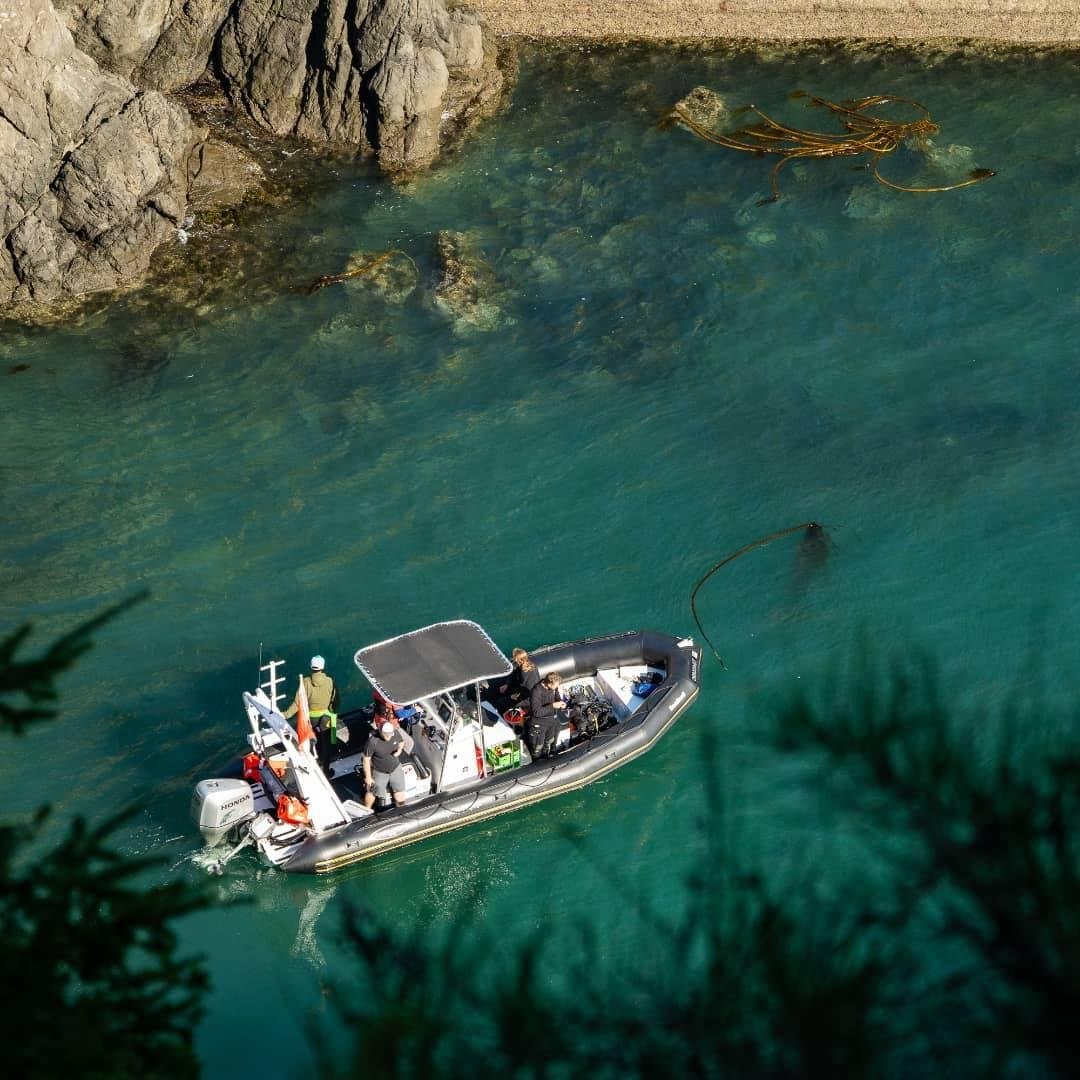
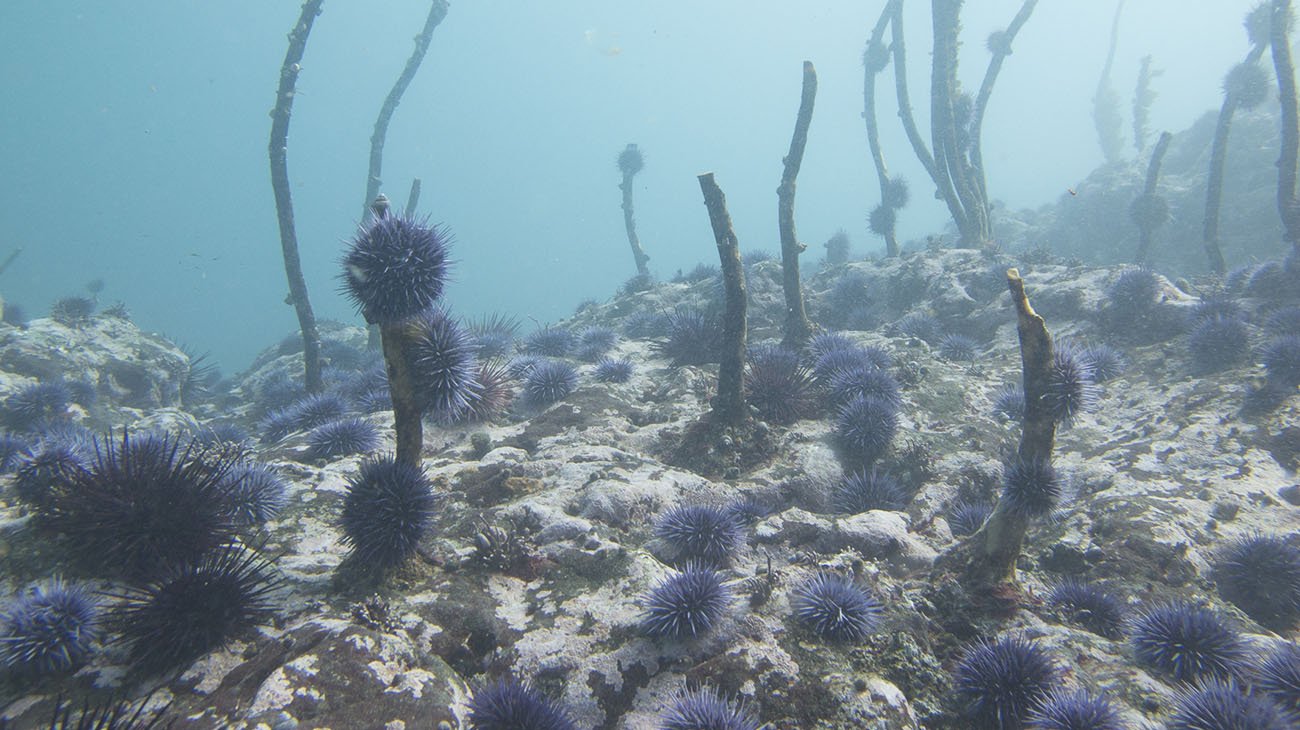
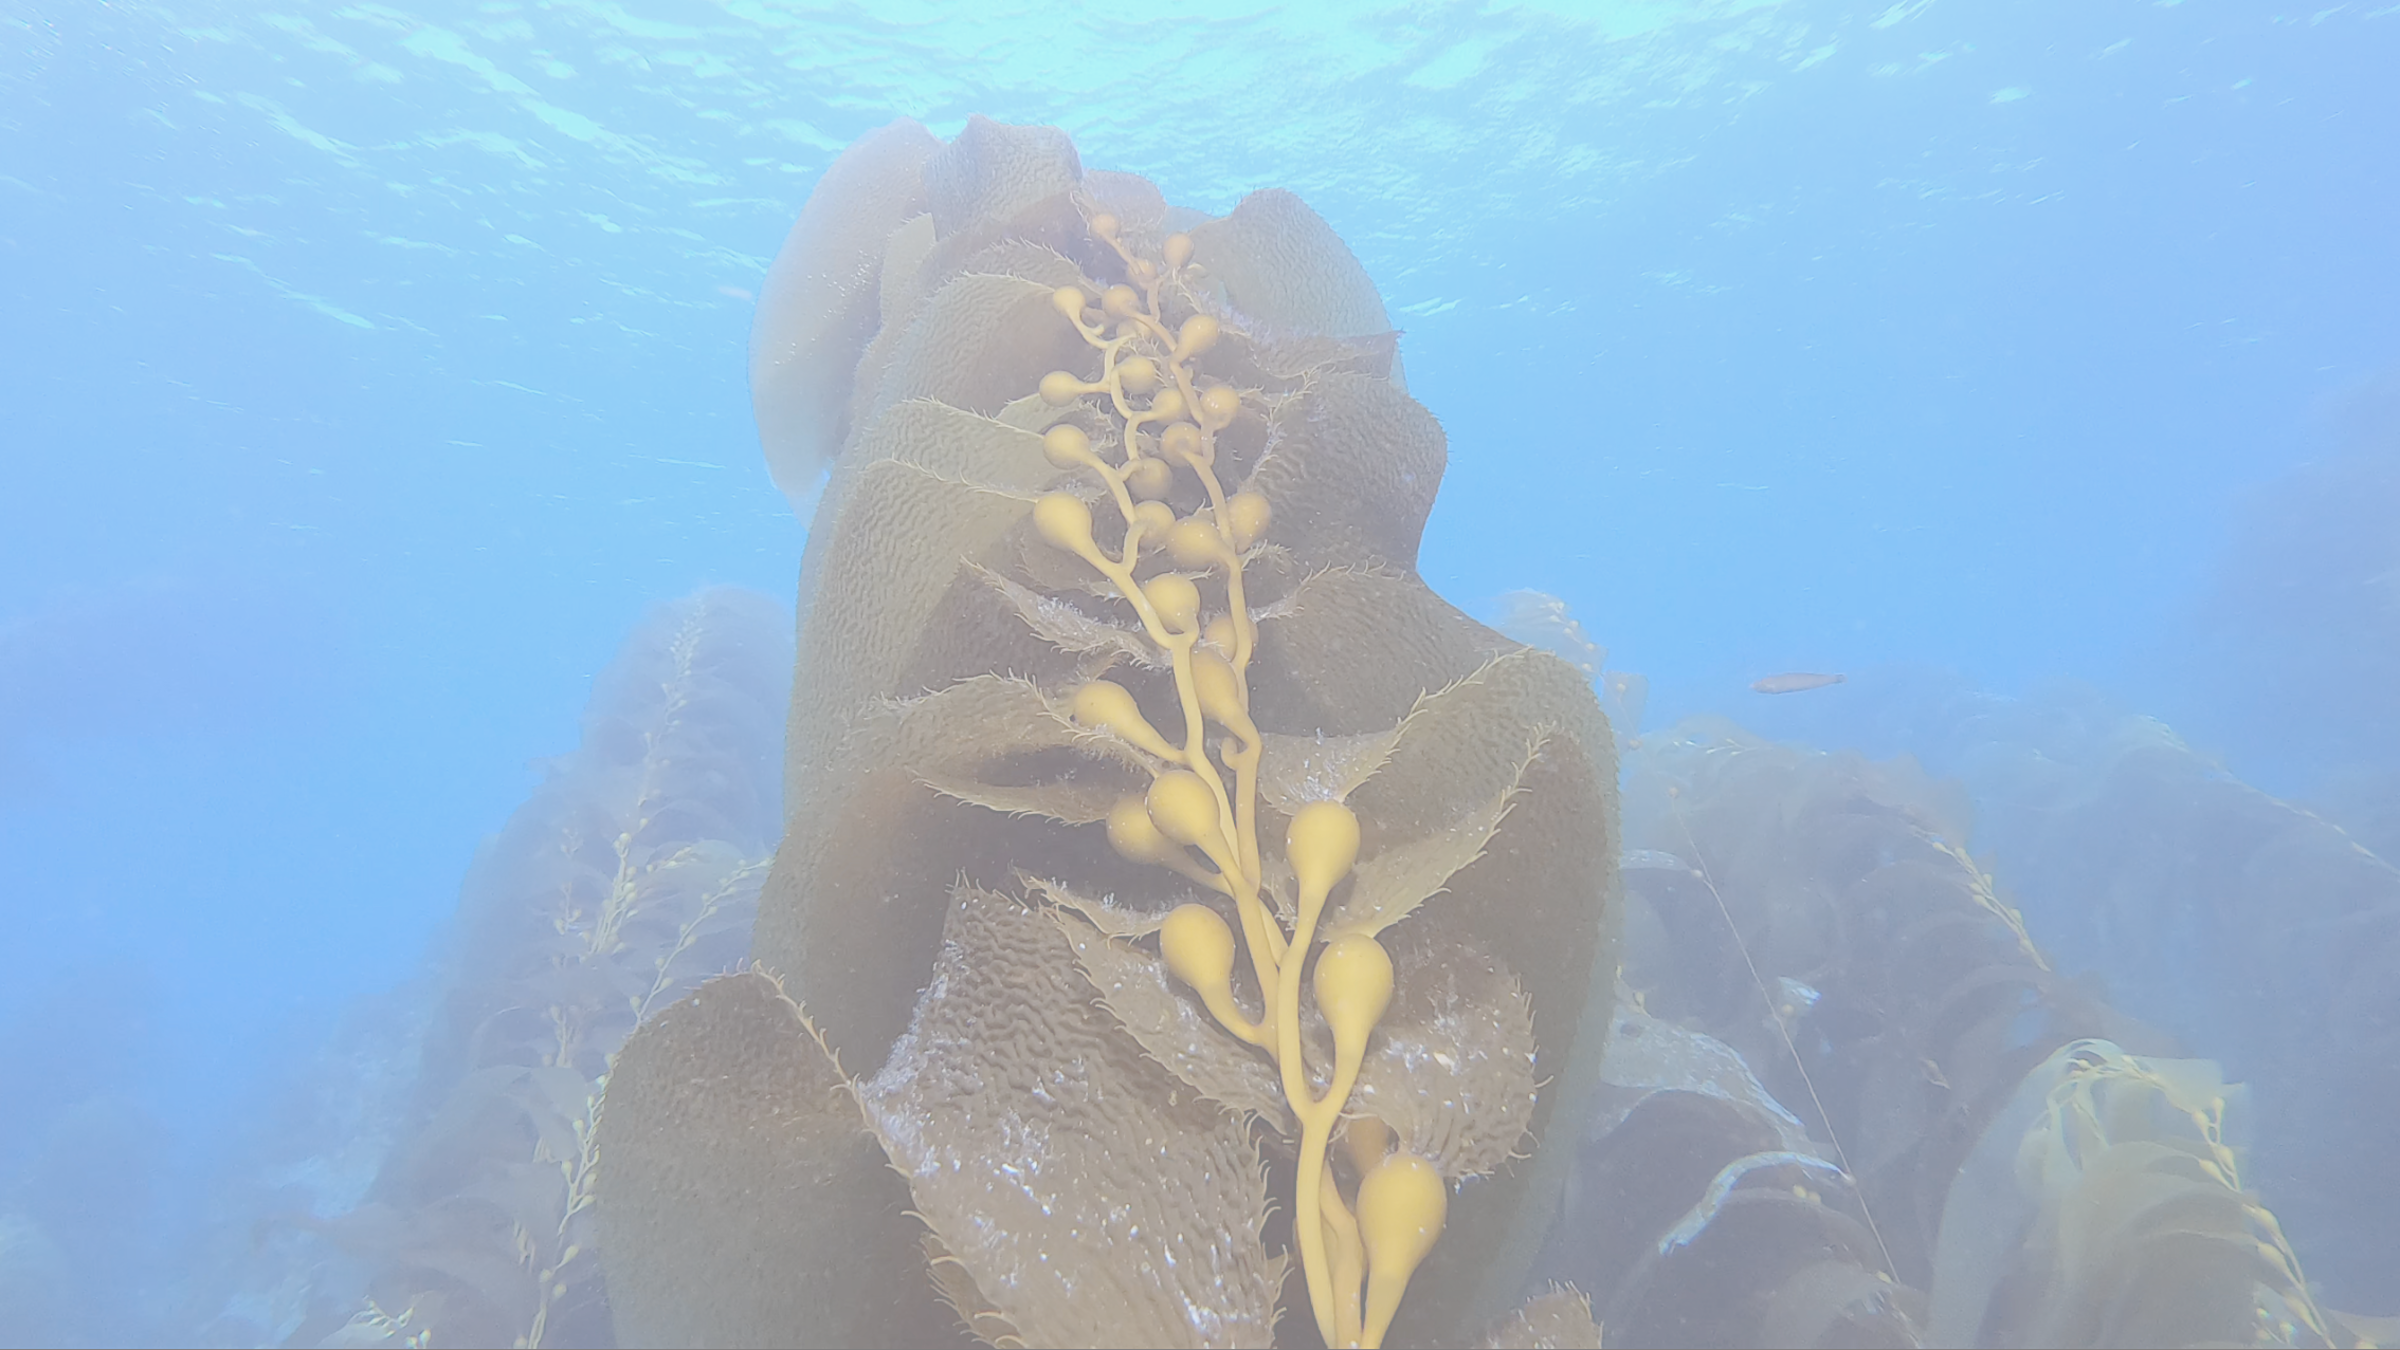
Photo Credit: kelp indicator export group members, including Oregon Kelp Alliance (ORKA), Tristin Anoush McHugh (The Nature Conservancy), and Pike Spector (California Ocean Protection Council).