
Explore the Indicator
Current Status
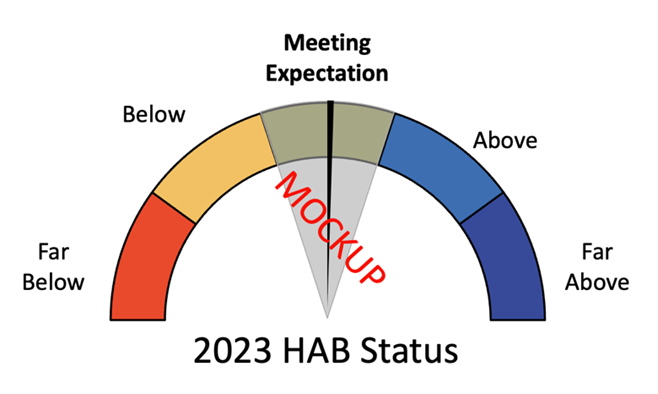
The average health score for the rocky intertidal for 2023 was -0.46. This was determined as the average abundance scores (-2 to 2) for four key focal taxa (rockweeds, mussels, seagrasses, and ochre sea stars). A negative score indicates that the average abundance of rocky intertidal organisms is lower compared to their average abundance during past baseline conditions (2004-2012). Regionally, health scores were lowest in Southern California (-0.52) and Central California (-0.83) and highest in the Channel Islands (-0.17) and Northern California (0.13).

.
.
.
Historic Trends
To study historic trends, abundance scores were compared to abundance scores during a predetermined baseline period (2004-2012). During this baseline period, some variability in focal taxa abundance occurred, however variations were generally small and temporary, and therefore likely indicative of normal fluctuations in species abundance that are present in all healthy ecosystems.
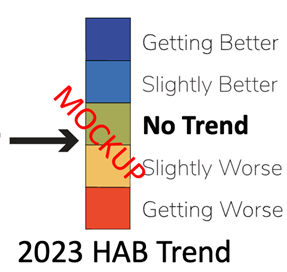
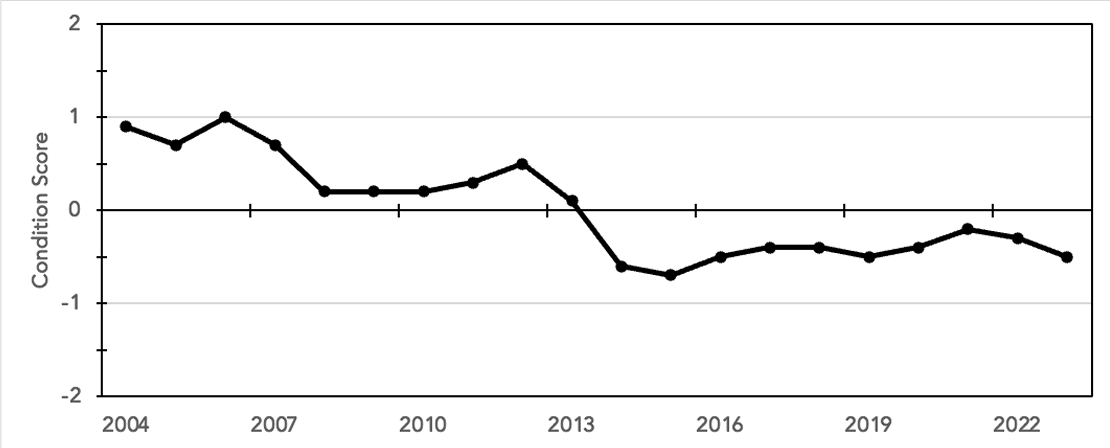
After 2012, species abundance scores have exhibited a strong and persistent decline, likely due to the combined effects of a major disease event (sea star wasting disease) and a marine heat wave (“the Blob”) arriving in the region around the same time. Overall, the rocky intertidal community has not recovered to the abundance levels measured during the baseline period, though this trend varies depending on the species and geographic regions being discussed.
Figure 1: Line graph showing the combined condition score of all four focal groups from 2004-2023. A horizontal line at 0 represents no change from the baseline period abundance (2004-2012).
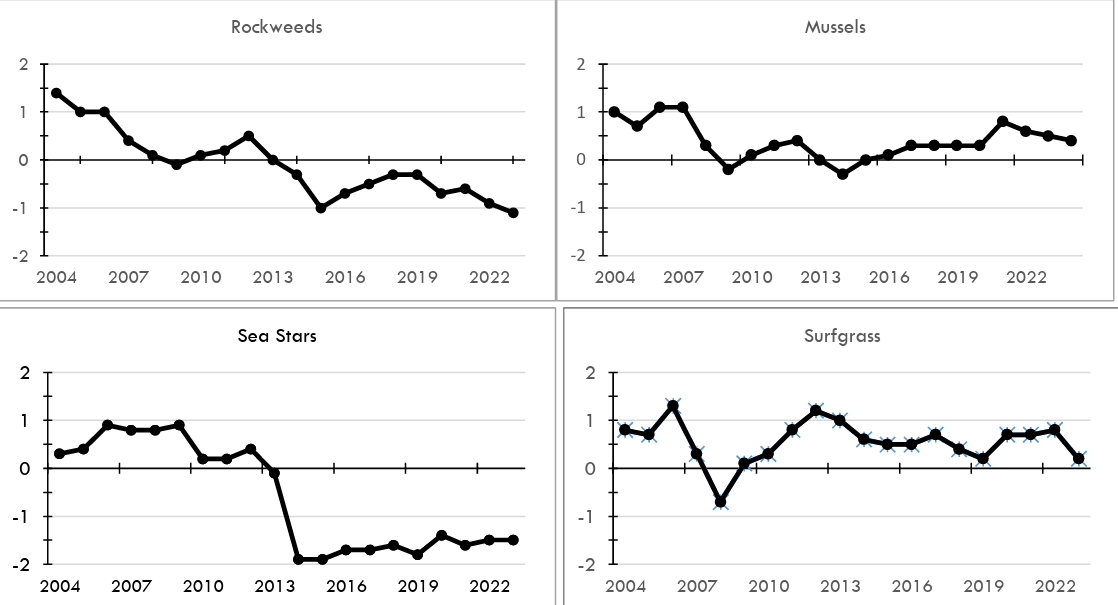
While mussels and surfgrass did show some declines throughout the measured time period, their abundance scores remained relatively stable over time. Conversely, sea stars and rockweeds have declined significantly, with sea stars especially experiencing extreme declines during the peak of sea star wasting disease in 2013 and 2014.
Figure 2: Line graphs showing the condition score for each focal groups from 2004-2023. A horizontal line at 0 represents no change from the baseline period abundance (2004-2012).
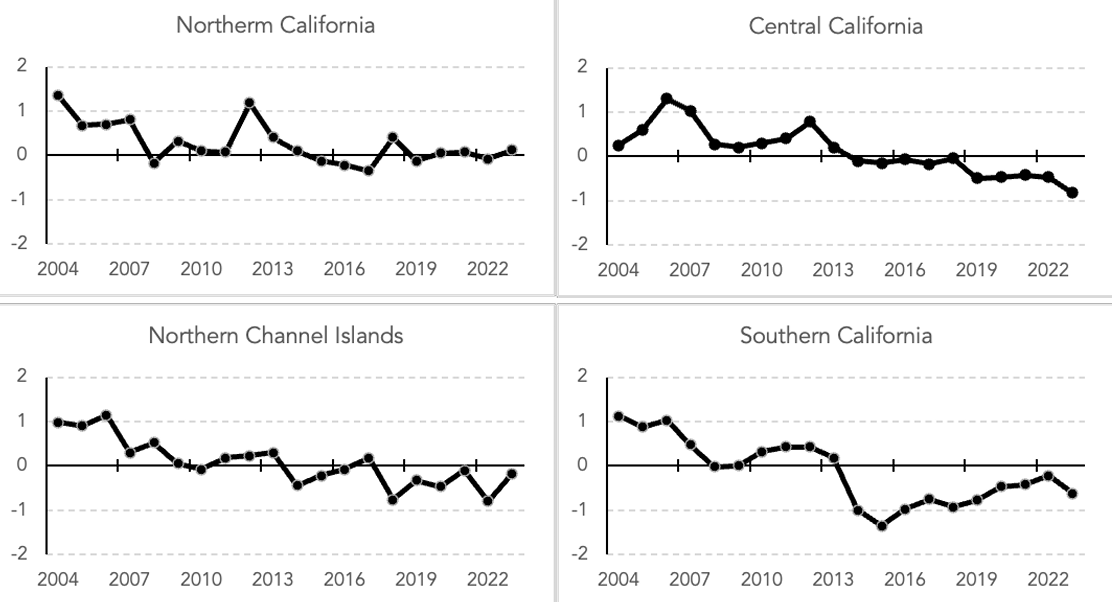
Southern and Central California have undergone the largest changes in community abundance since 2012, while Northern California seems to have recovered to a community abundance state similar to those seen during the baseline period.
Figure 3: Line graph showing the combined condition score across four geographic regions (Northern, Central, and Southern California and the Channel Islands) from 2004-2023. A horizontal line at 0 represents no change from the baseline period abundance (2004-2012).

.
.
Interactive Map
Use the interactive map below to view more detailed information related to the rocky intertidal indicator, including site-specific results and a time-lapse of historic trends in indicator scores since 2004.