Methods
To assess the health of the rocky intertidal, we combined the efforts of multiple, long-term monitoring datasets from intertidal research groups along our coastline. The two primary contributors to our indicator are the Multi-Agency Rocky Intertidal Network (MARINe) and the Partnership for Interdisciplinary Study of Coastal Oceans (PISCO). Using these datasets, our expert working group identified four key focal groups (sea stars, mussels, rockweeds, and seagrasses) that shape the rocky intertidal along the West Coast and are key contributors to the stability and resilience of the community. Recent trends in the abundance of these groups along the West Coast were analyzed and compared to a “baseline” time period of 2004 to 2012 prior to major climate change-related events along our coast. The results and trends from these four focal groups were combined into a single, community-wide metric that our indicator expert working group used to assess the status and historical trends compared to the baseline for the rocky intertidal.
Dataset Selection
To reliably evaluate large-scale changes over multiple decades, datasets were selected that were long-term, methodologically consistent, and geographically widespread. Two West Coast research groups, the Multi-Agency Rocky Intertidal Network (MARINe) and the Partnership for Interdisciplinary Study of Coastal Oceans (PISCO) have been monitoring multiple field locations across the region since the 2000s using similar field methodology. MARINe datasets extended from the Southern California border to the Northern Washington border, with the most regularly sampled locations being in California. PISCO datasets were primarily focused along the Oregon Coast, with some field locations in Northern California. In addition to these multi-state research groups, long-term ecological monitoring data from the Olympic National Park region were used to increase coverage along the Washington Coast.
Field Methods
Partnership for Interdisciplinary Study of Coastal Oceans (PISCO)
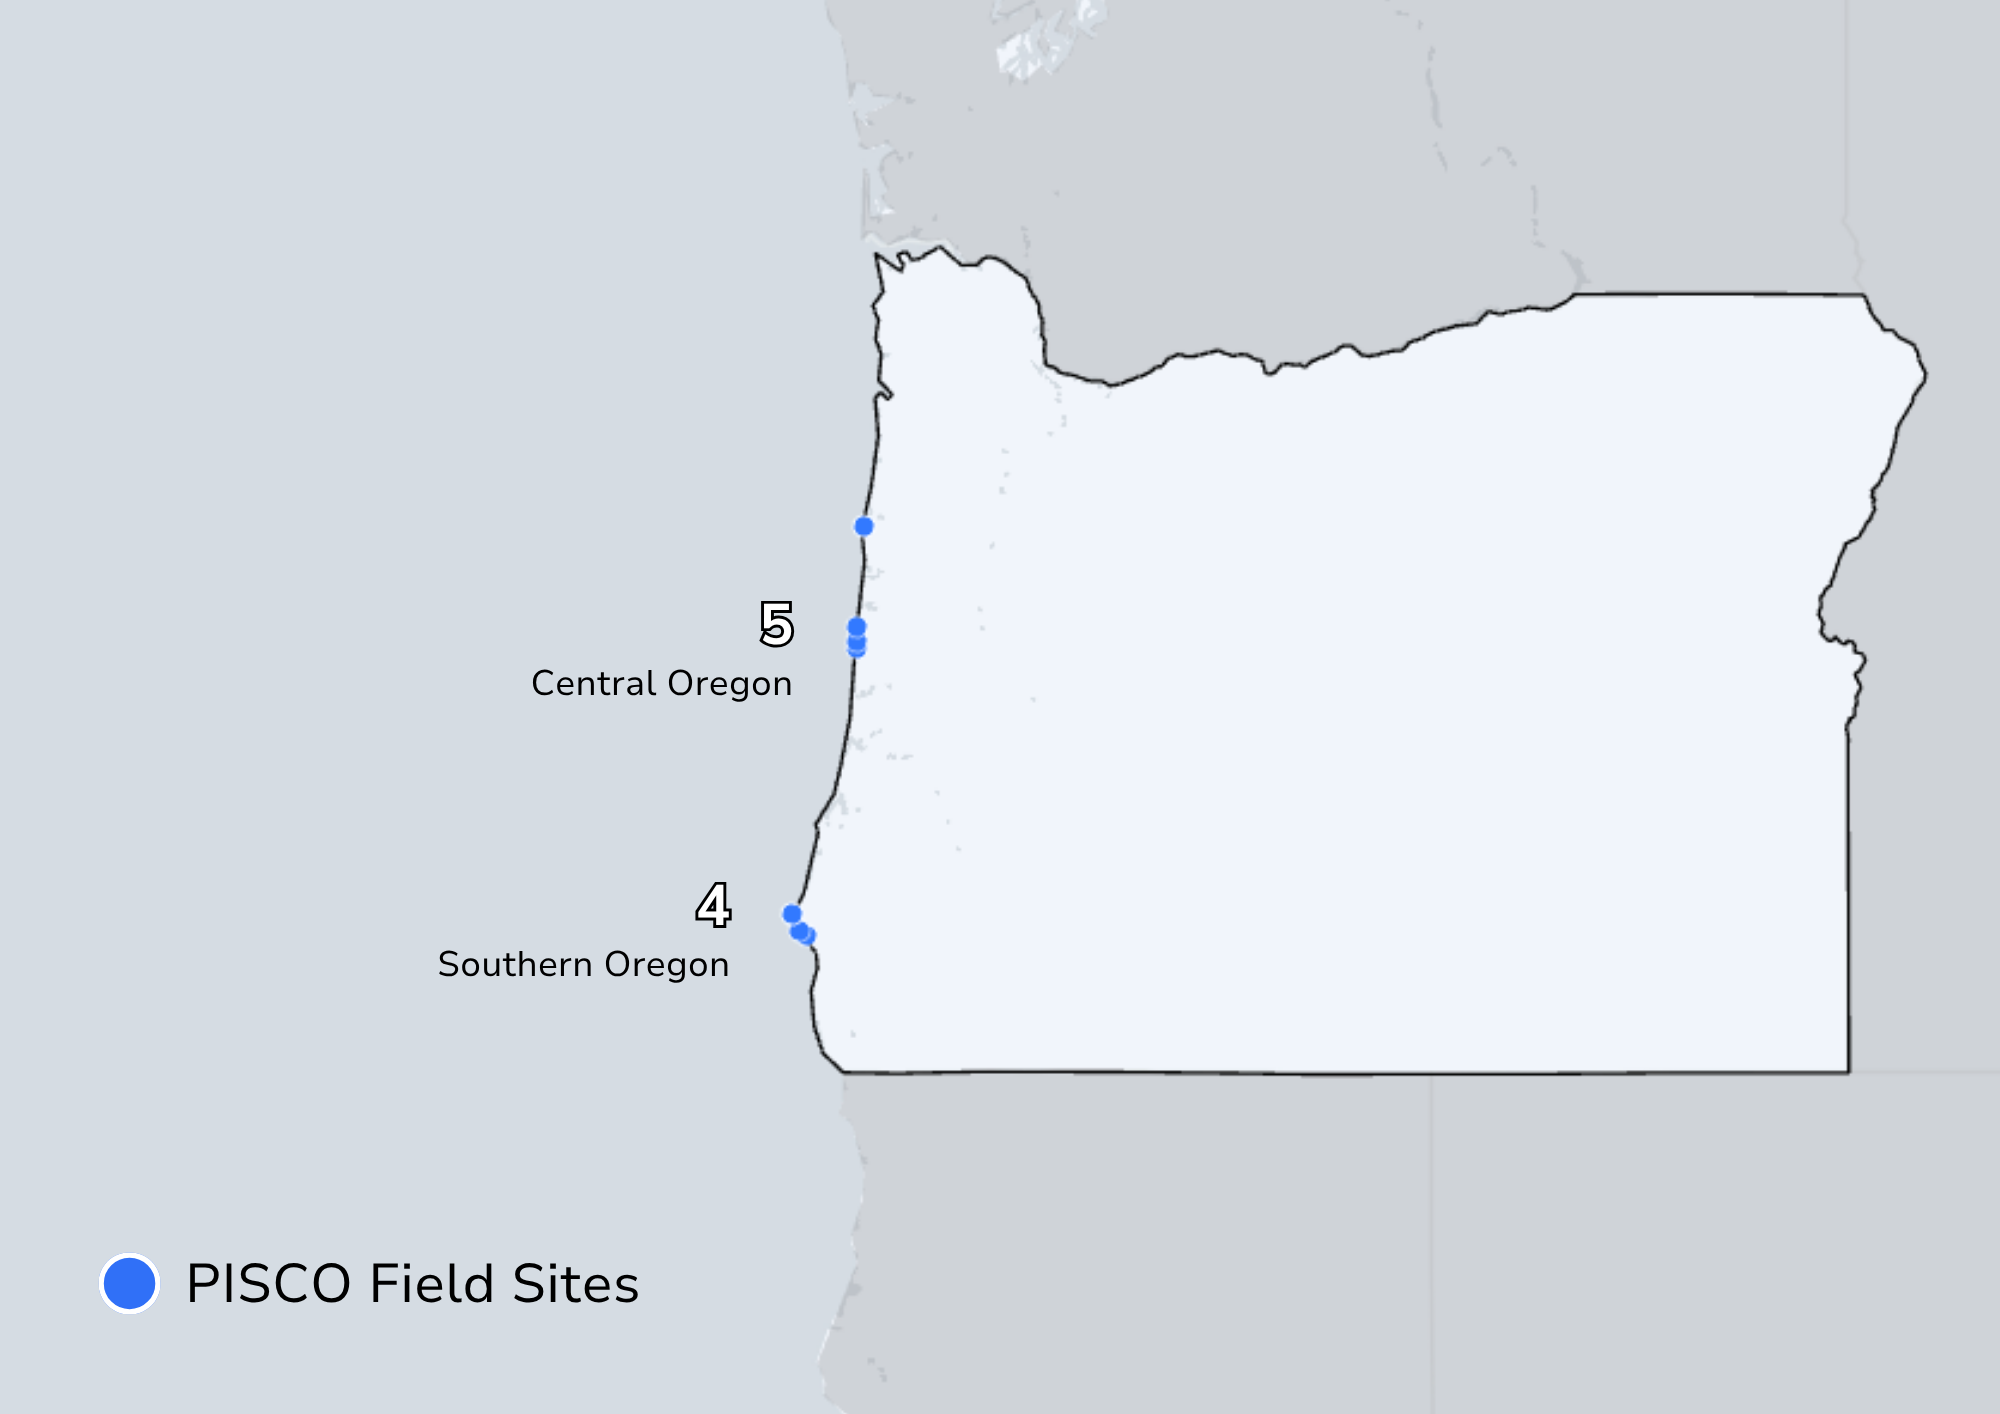
Beginning in 2011, PISCO has conducted annual community surveys at 11 locations across Northern California and Oregon. For each site, 10 randomly placed 25 x 25cm quadrats were placed along a transect line in the low, mid, and high zone, with the abundance of each species within a quadrat measured via percent cover (for sessile organisms) or individual counts (for mobile organisms).
For more detailed information, please consult the field methodology section of Gravem et al. 2024.
Multi-Agency Rocky Intertidal Network (MARINe)
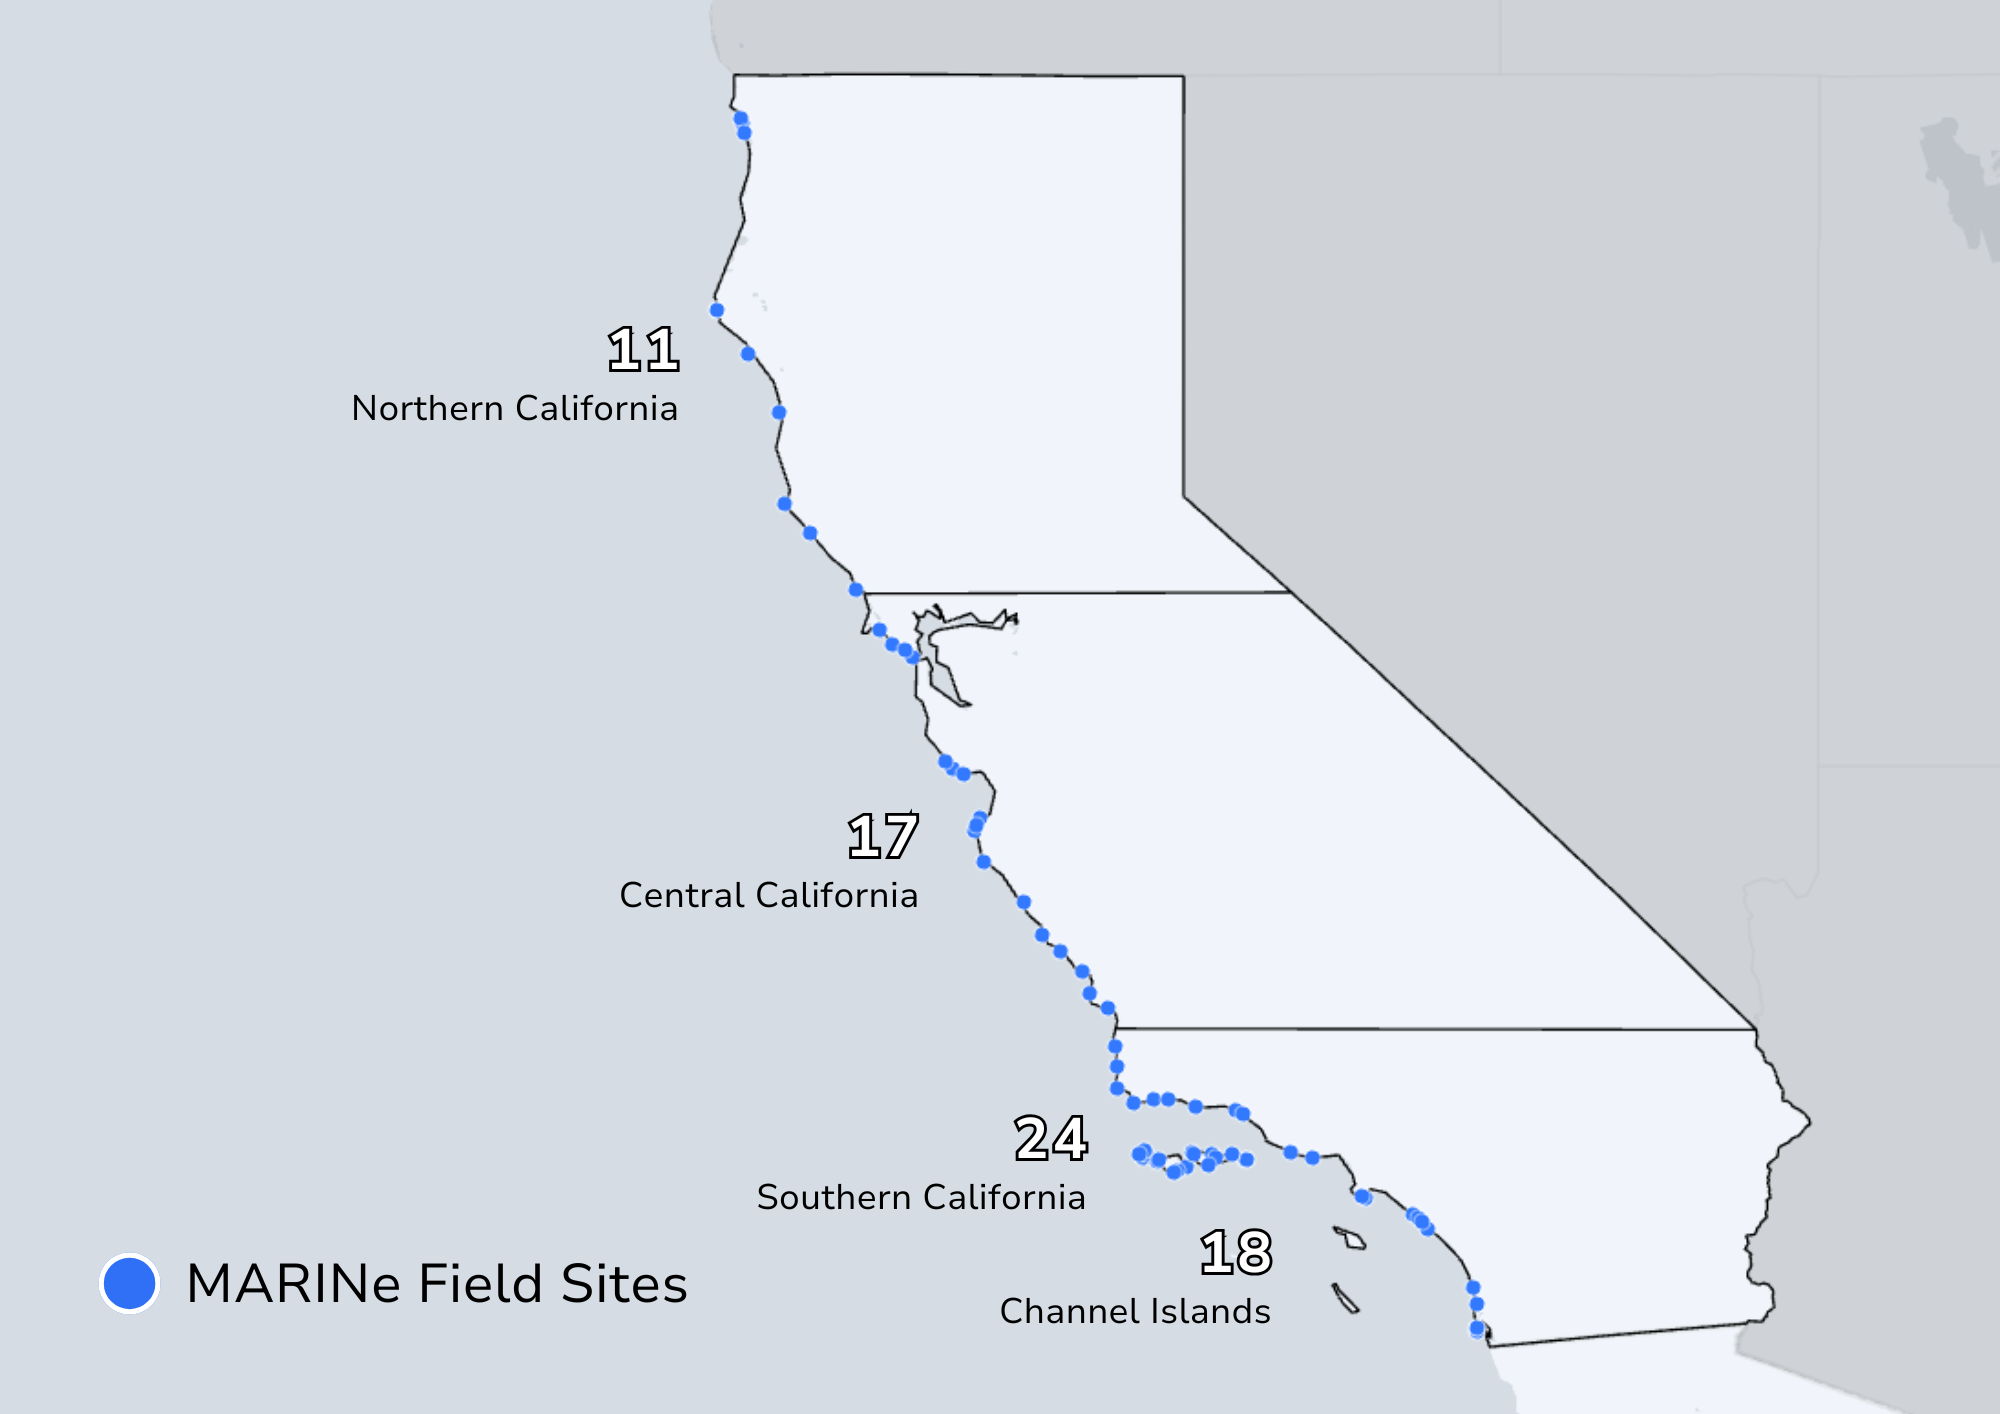
A total of 66 sites were sampled annually across the California coast beginning in 2004. At each site, abundance data were recorded for various focal taxa using a variety of methods. For rockweeds and mussels, permanent 50 x 75 cm field plots were installed in high abundance areas for each target species. Plots were then photographed and analyzed once per year to determine species abundance through their percent cover of the plot area. For seagrasses, the percent cover of seagrasses was measured along permanent 10m transect lines in the low zone. For sea stars, irregular plots within fixed areas were used to count sea star abundance.
For more detailed information, please consult the MARINe Long-Term Monitoring Surveys site.
Use the tool below to view full information on the field sites used for this analysis:
Indicator Analysis
Conceptualization of Indicator
The West Coast Ocean Alliance (WCOA) Ocean Health Dashboard project was conceptualized by members of WCOA and the West Coast Ocean Data Portal (WCODP) in 2019. In 2026, the Southern California Coastal Water Research Project (SCCWRP) was contracted by WCOA to complete work on indicators for the Ocean Health Dashboard, which included an indicator for rocky intertidal communities. WCOA’s Ocean Health Dashboard working group and SCCWRP compiled a list of rocky intertidal experts from along the West Coast, who would be tasked with determining which datasets should be used, how an indicator should be developed from these data, and how the final indicator should be interpreted to understand the current health status and historic trends of the West Coast rocky intertidal.
Analysis of Focal Taxa
Instead of analyzing rocky intertidal community trends broadly, focal taxa were selected that were determined by the indicator expert working group to have strong influence on community stability and resilience. While the trends in abundance of these four species cannot precisely mirror the overall trends in community structure for the hundreds of rocky intertidal species along the West Coast, full community data is more complex and less available than species-specific datasets. The expert working group determined that the selected focal groups would have a strong enough influence on overall community trends that trends in their abundance could be interpreted generally as trends in overall community health, which greatly simplified the indicator analysis and development process.
Four focal taxa were selected that would be evaluated individually, then collectively, to assess rocky intertidal community health. The four focal taxa selected were: mussels (Mytilus spp.), rockweeds (Fucoid seaweeds), surfgrass (Phyllospadix spp.), and ochre sea stars (Pisaster ochraceus). Three of these taxa are foundation species that provide shaded habitat and food to other organisms (mussels, rockweeds, and surfgrass). One species is a keystone predator that regulates the abundance of space-occupying organisms (ochre sea stars).
Assessment of Community Trends
As rocky intertidal communities tend to be highly variable between field sites, all analysis was conducted within each site and then averaged across larger geographic scales to reduce the effects of any site-to-site variability. For each focal group at a given site in a given year, a health score (-2, -1, 0, 1, 2) was assigned based on the abundance of that taxon compared to its average abundance at that site during the baseline comparison period (2004-2012). Once scores were assigned for each taxon, scores for all four focal taxa were averaged to provide an overall community score for each site at each year. These community scores were then averaged across major geographic regions (Washington, Oregon, Northern California, Central California, Channel Islands, Southern California) to provide annual scores per region. Trends in community health scores over time were calculated as the linear change over time in annual statewide scores. Patterns and trends in rocky intertidal community health scores were assessed by the indicator expert working group to draw conclusions on the 2023 status and historic trends of rocky intertidal communities along the West Coast.
Acknowledgements
Indicator Expert Working Group
- Rich Ambrose, University of California Los Angeles
- Jennifer Burnaford, California State University Fullerton
- Jessica Curran, United States Navy
- Megan Dethier, University of Washington
- Steve Fradkin, Olympic National Park
- Lisa Gilbane, Bureau of Ocean Energy Management (ret.)
- David Gillett, Southern California Coastal Water Research Project
- Bruce Menge, Oregon State University
- Monica Moritsch, University of California Santa Cruz
- Karina Nielsen, Oregon Sea Grant
- Jayson Smith, California Polytechnic State University Pomona
- Steve Weisberg, Southern California Coastal Water Research Project
- Steve Whitaker, Channel Islands National Park